> ## Documentation Index
> Fetch the complete documentation index at: https://docs.powertokens.ai/llms.txt
> Use this file to discover all available pages before exploring further.
# 查看日志和用量统计
> 使用 Logs 和 Dashboard 追踪请求、排查错误并控制 Credits 消耗。
发起模型请求后,你可以在 **Logs** 和 **Dashboard** 中查看调用结果、分析异常并控制成本。
## 查看调用日志
打开 [**Logs**](https://www.powertokens.ai/zh-Hans/logs) 页面,查看 API 请求记录。
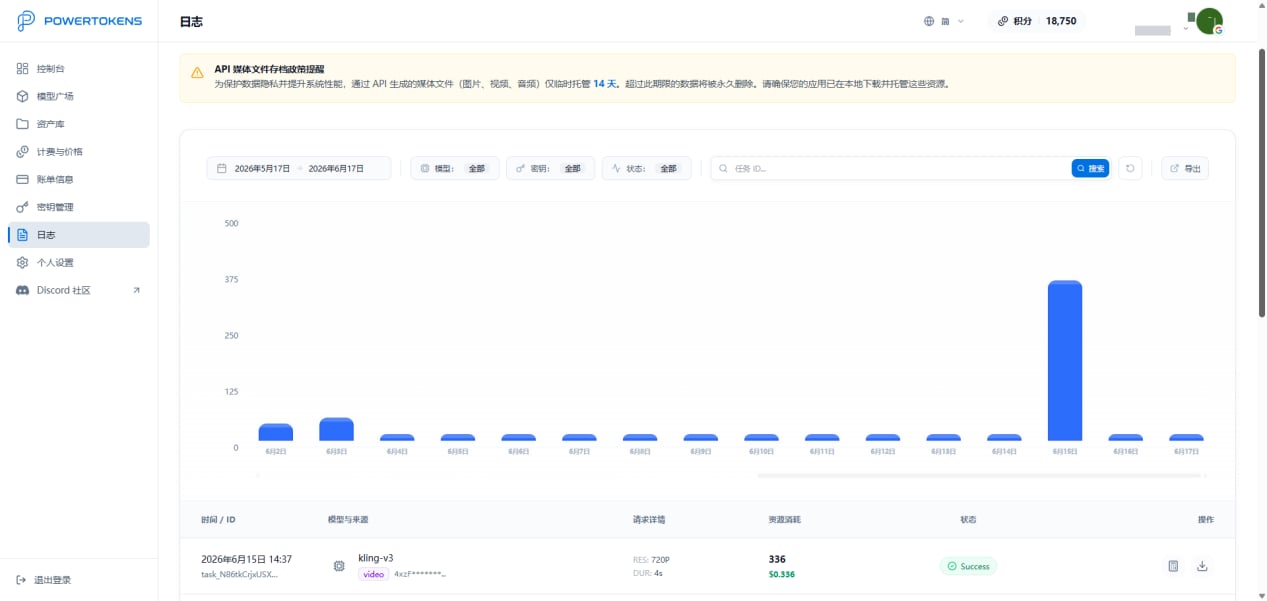 日志中心可以帮助你:
* 查看请求记录
* 追踪生成结果
* 定位调用异常
* 分析错误信息
* 调试请求参数
排查问题时,先确认请求时间、模型名称、请求参数和错误信息是否符合预期。
## 查看用量统计
打开 [**Dashboard**](https://www.powertokens.ai/zh-Hans/dashboard) 页面,查看资源消耗情况。
日志中心可以帮助你:
* 查看请求记录
* 追踪生成结果
* 定位调用异常
* 分析错误信息
* 调试请求参数
排查问题时,先确认请求时间、模型名称、请求参数和错误信息是否符合预期。
## 查看用量统计
打开 [**Dashboard**](https://www.powertokens.ai/zh-Hans/dashboard) 页面,查看资源消耗情况。
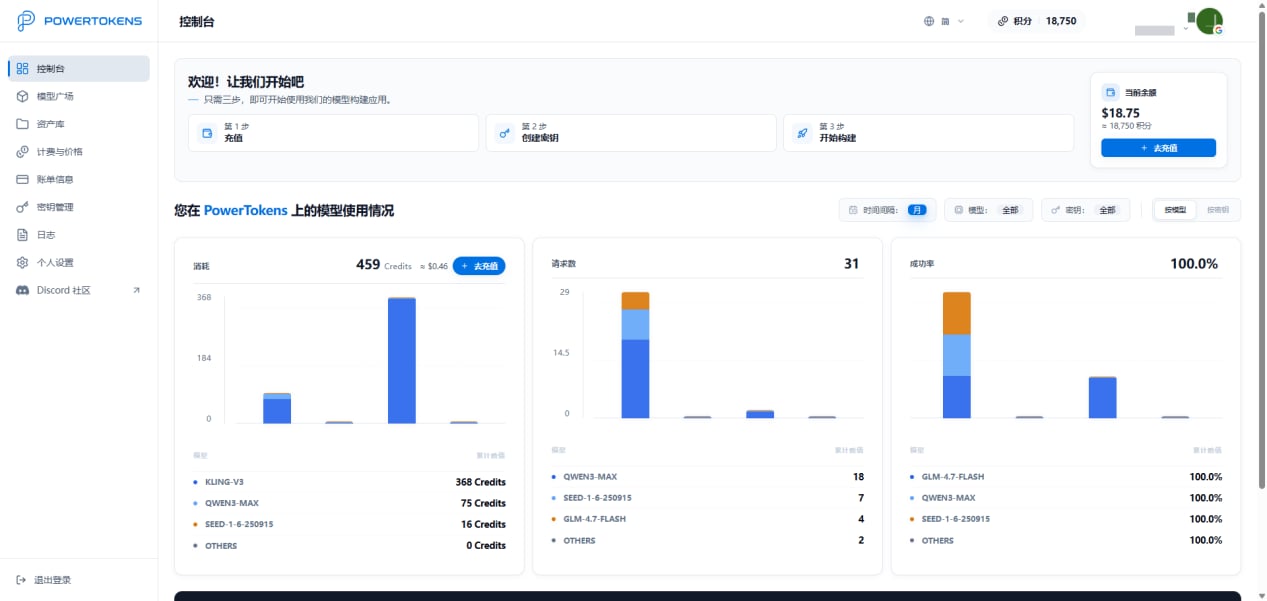 你可以从模型和 API Key 维度分析用量:
* Credits 消耗
* 请求次数
* 成功率
* Key 消耗情况
这些数据可以帮助你控制成本并分析业务使用情况。
## 获取帮助与支持
如果你在使用过程中遇到问题,可以通过以下方式联系 PowerTokens:
* 邮件:`service@powertokens.ai`
* Discord:[https://discord.gg/bWA4EaFQ4](https://discord.gg/bWA4EaFQ4)
你可以从模型和 API Key 维度分析用量:
* Credits 消耗
* 请求次数
* 成功率
* Key 消耗情况
这些数据可以帮助你控制成本并分析业务使用情况。
## 获取帮助与支持
如果你在使用过程中遇到问题,可以通过以下方式联系 PowerTokens:
* 邮件:`service@powertokens.ai`
* Discord:[https://discord.gg/bWA4EaFQ4](https://discord.gg/bWA4EaFQ4)